Warning
This tutorial is based on MUMmer 3x
1. Introduction
Because of its breadth MUMmer can, at first glance, be an overwhelming sea of scripts and subroutines. This document attempts to walk the user through some of the more useful modules of the package, and provides example data and expected outputs to assure the correct and productive operation of MUMmer. All example data is real DNA sequence from various eukaryotic and prokaryotic organisms, and can be found in its entirety in the data directory. Although the input sequences are only subsections of their respective genomes, they have been carefully selected to permit speedy and informative walk-throughs. It is not necessary to download all of the data at once, as each subsection will have separate links to the relevant files.
For further information regarding any of the MUMmer programs or their output formats, please refer to the online MUMmer manual.
2. Examples
2.1. mummer
mummer is a suffix tree algorithm designed to find maximal exact matches of some minimum length between two input sequences. The match lists produced by mummer can be used alone to generate alignment dot plots, or can be passed on to the clustering algorithms for the identification of longer non-exact regions of conservation. These match lists have great versatility because they contain huge amounts of information and can be passed forward to other interpretation programs for clustering, analysis, searching, etc.
In the following sections, a short example is given that demonstrates how to use mummer. This example compares a single query sequence to a single reference sequence using mummer, and then uses mummerplot to generate a dot plot representation of the comparison.
The following input files will be used to demonstrate this example:
The following output files will be generated by this example:
2.1.1. Running mummer
mummer can handle multiple reference and multiple query sequences, however a dotplot of more that two sequences can be confusing, so for the case of this example we will be dealing with a single reference and a single query sequence.
mummer -mum -b -c H_pylori26695_Eslice.fasta H_pyloriJ99_Eslice.fasta > mummer.mumsThis command will find all maximal unique matches (-mum) between the reference and query on both the forward and reverse strands (-b) and report all the match positions relative to the forward strand (-c). Output is to stdout, so we will redirect it into a file named mummer.mums. This file lists all of the MUMs of the default length or greater between the two input sequences.
2.1.2. Running mummerplot
A dotplot of all the MUMs between two sequences can reveal their macroscopic similarity.
mummerplot -x "[0,275287]" -y "[0,265111]" -postscript -p mummer mummer.mumsThis command will plot all of the MUMs in the mummer.mums file in postscript format (-postscript) between the given ranges for the X and Y axes. When plotting mummer output, it is necessary to use the lengths of the input sequences to set the plot ranges, otherwise the plot will be automatically scaled around the minimum and maximum data points. The four output files are prefixed by the string specified with the -p option. The plot files contains the data points, mummer.gp is a gnuplot script for plotting the data points in the plot files, and mummer.ps is the postscript plot generated by the gnuplot script. Below, you can see the mummer.ps file displayed with ghostview. Note that with newer versions of mummerplot the color and thickness of the plot lines may be different.
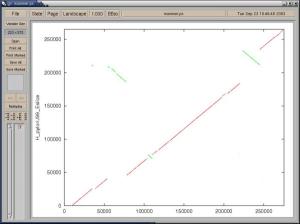
Most image manipulation programs can edit the postscript output, or it can be sent directly to a printer with the lpr command. If you would rather use the default terminal for gnuplot, simply remove the -postscript option from the mummerplot call.
2.1.3. Viewing the output
The above postscript plot represents the set of all MUMs between the two input sequences used in this example. Forward MUMs are plotted as red lines/dots while reverse MUMs are plotted as green lines/dots (blue may be used for reverse matches in newer versions). A line of dots with slope == 1 represents an undisturbed segment of conservation between the two sequences, while a line of slope == -1 represents an inverted segment of conservation between the two sequences. The green segment in the upper left quadrant of the graph shows both an inversion and translocation, as it is of negative slope and inconsistently located relative to the rest of the plot which falls on a line approximated by f(x) = x. However the green segment in the upper right quadrant of the graph shows only an inversion, as it is of negative slope but is consistent in location with the rest of the plot. Generally, the closer a plot is to an imaginary line f(x) = x (or -x) the fewer macroscopic differences exist between the two sequences.
2.2. nucmer
nucmer is MUMmer's most user-friendly alignment script for standard DNA sequence alignment. It is a robust pipeline that allows for multiple reference and multiple query sequences to be aligned in a many vs. many fashion. For instance, a very common use for nucmer is to determine the position and orientation of a set of sequence contigs in relation to a finished or draft genome. It is equally useful in comparing two finished sequences, or two assemblies of the same genome to one another.
In the following sections, a short example is given that demonstrates how to use nucmer. This example aligns a set of draft sequence contigs to a finished sequence using nucmer; displays the alignment coordinates using show-coords; and tiles them across the reference using show-tiling.
The following input files will be used to demonstrate this example:
The following output files will be generated by this example:
2.2.1. Running nucmer
Like mummer, nucmer can handle multiple reference and query sequences, however this example will demonstrate the alignment of multiple query sequences to a single reference. We will align a number of B. anthracis draft contigs to the final assembly.
nucmer -mumreference -c 100 -p nucmer B_anthracis_Mslice.fasta B_anthracis_contigs.fastaThe -mumreference option can be omitted as this is the default; this reports all matches that are maximal in length and that are unique (after extending to maximal length) in the reference genome. You could instead use -maxmatch, which reports all matches regardless of uniqueness, but be very careful with this option: if you have N repeats in a genome, then you will be instructing nucmer to report N^2 alignments (all versus all), which you probably don't want. The minimum cluster size here is bumped up to 100 (-c 100). The two output files are prefixed by the string specified with the -p option. nucmer.delta is an encoded file that represents the alignment between the two inputs. At this stage, the alignment of the two inputs is complete, however it is necessary to parse the nucmer.delta file with the provided utilities in order to extract useful information from the comparison.
2.2.2. Running show-coords
To view a summary of all the alignments produced by NUCmer, we can run the nucmer.delta file through the show-coords utility.
show-coords -r -c -l nucmer.delta > nucmer.coordsThis command will list the coordinates, percent identities and other useful statistics of each alignment in a table. Each line of the table represents an individual pairwise alignment, and each line is sorted by its starting reference coordinate (-r). Additional information, like alignment coverage (-c) and sequence length (-l) can be added to the table with the appropriate options. Output is to stdout, so we have redirected it into the file, nucmer.coords.
2.2.3. Running show-snps
To view a summary of all the SNPs and indels between the two sequence sets, we need to run the nucmer.delta file through the show-snps utility.
show-snps -C nucmer.delta > nucmer.snpsThis will generate a report of all the SNPs internal to the alignments contained in the nucmer.delta file. Each line of the table represents a single mismatch in the pairwise alignment. With the -C option, only SNPs from uniquely aligned regions will be reported. Additional information can be added or removed with the command line switches described in the manual. Output is to stdout, so we have redirected it into the file, nucmer.snps.
2.2.4. Running show-tiling
To produce a minimal tiling of contigs across the reference sequence, we need to run the nucmer.delta file through the show-tiling utility.
show-tiling nucmer.delta > nucmer.tilingThis command will list the contigs and positions that generate the maximal alignment coverage across the reference sequence using the fewest contigs possible. This output can aid the closure of a draft genome when a closely related organism has already be finished.
2.2.5. Viewing the output
nucmer and show-tiling output can both be viewed with mummerplot, however these plots would offer little more information in regards to this example.
2.3. promer
promer is a close relative to the NUCmer script. It follows the exact same steps as NUCmer and even uses most of the same programs in its pipeline, with one exception - all matching and alignment routines are performed on the six frame amino acid translation of the DNA input sequence. This provides promer with a much higher sensitivity than nucmer because protein sequences tends to diverge much slower than their underlying DNA sequence. Therefore, on the same input sequences, promer may find many conserved regions that nucmer will not, simply because the DNA sequence is not as highly conserved as the amino acid translation.
In the following sections, a short example is given that demonstrates how to use promer. This example aligns a few query sequences to single reference sequence using promer; displays the alignment coordinates using show-coords; and prints a pairwise alignment of one of the contigs using show-aligns.
The following input files will be used to demonstrate this example:
The following output files will be generated by this example:
2.3.1. Running promer
Like mummer, promer can handle multiple reference and query sequences, however it is most commonly used to map a set of query sequences to a single reference sequence. This example will demonstrate that functionality, as two D. pseudoobscura draft contigs will be mapped to the final D. melanogaster assembly.
promer -p promer D_melanogaster_2Rslice.fasta D_pseudoobscura_contigs.fastaDefault parameters were used to align the two inputs, however if the alignment is too sensitive or not sensitive enough the minimum match length and cluster sizes can be adjusted accordingly. The two output files are prefixed by the string specified with the -p option. promer.delta is an encoded file that represents the alignment between the two inputs. At this stage, the alignment of the two inputs is complete, however it is necessary to parse the promer.delta file with the provided utilities in order to extract useful information from the comparison.
2.3.2. Running show-coords
To view a summary of all the alignments produced by PROmer, we need to run the promer.delta file through the show-coords utility.
show-coords -r -c -l -L 100 -I 50 promer.delta > promer.coordsThis command will list the coordinates, percent identities and other useful statistics of each alignment in a table. Each line of the table represents an individual pairwise alignment, and each line is sorted by its starting reference coordinate (-r). Additional information, like alignment coverage (-c) and sequence length (-l) can be added to the table with the appropriate options. And minimum length (-L) and minimum percent identity (-I) cutoffs can be specified to reduce poor alignments. Output is to stdout, so we have redirected it into the file, promer.coords.
2.3.3. Running show-aligns
To view all the pairwise alignments between two of the input sequences, we need to run the promer.delta file through the show-coords utility.
show-aligns promer.delta "D_melanogaster_2Rslice" "3214968" > promer.alignsThis command will print all of the pairwise alignments stored in the promer.delta file for the sequences "D_melanogaster_2Rslice" and "3214968". Output is to stdout, so we have redirected it into the file, promer.aligns. If the alignments do not fit within your screen width, or you would like them to be printed on longer lines, the screen width can be adjusted with the -w option. Since show-aligns only displays the alignments between two sequences, it will have to be run separately for each desired pair of sequences.
2.3.4. Viewing the output
promer and show-tiling output can both be viewed with mummerplot, however these plots would offer little more information in regards to this example.
2.4. run-mummer1
run-mummer1 is a legacy script from the original MUMmer1.0 release. It has been updated to utilize the new suffix tree code of version 3.0, however all other programs called from this script are identical to the original MUMmer release back in 1999. Even though it is an outdated program, it still has some advantages over the newer alignment scripts (nucmer, promer, run-mummer3). Like all of the alignment scripts, run-mummer1 is a three step process - matching, clustering and extension. However, unlike the newer alignment scripts, run-mummer1 uses the gaps program for its clustering step. The gaps program does not allow for rearrangements like mgaps, instead if finds the single longest increasing subset of matches across the full length of both sequences. This makes it well suited for SNP and small indel identification between small (< 10 Mbp), very similar sequences with few to no rearrangements.
In the following sections, a short example is given that demonstrates how to use run-mummer1. This example aligns a single query sequence to a single reference sequence using run-mummer1.
The following input files will be used to demonstrate this example:
The following output files will be generated by this example:
2.4.1. Running run-mummer1
run-mummer1 is only suited for a single reference and query sequence that have few to zero inversions or translocations. This example aligns two such sequences.
run-mummer1 H_pylori26695_Bslice.fasta H_pyloriJ99_Bslice.fasta mummer1To adjust the minimum match length for the comparison, the user must manually edit the run-mummer1 script. Output files are prefixed by the string specified at the end of the command line call. mummer1.align displays the alignments of each gap between adjacent MUMs, mummer1.errorsgaps lists each MUM and the number of errors between it and the previous MUM, mummer1.gaps lists the ordered set of MUMs and the gap distance to the previous MUM, and mummer1.out simply lists all of the MUMs greater than or equal to the minimum match length.
2.4.2. Viewing the output
There are no visualization tools designed for run-mummer1 output. To view a MUM dotplot, run mummer by itself on two individual sequence as demonstrated in the mummer walkthrough section of this tutorial.